
SpinTrack: bringing lot-level quality tracking to a spinning mill that sold yarn by reputation
A cotton spinning mill had built its name on consistent yarn, but quality records lived in lab registers and production numbers in shift logs. When a buyer complained, tracing a lot back to its cotton bales took days. We built SpinTrack: bale-to-cone traceability, lab test capture, machine-wise production tracking, quality alerts and buyer certificates.
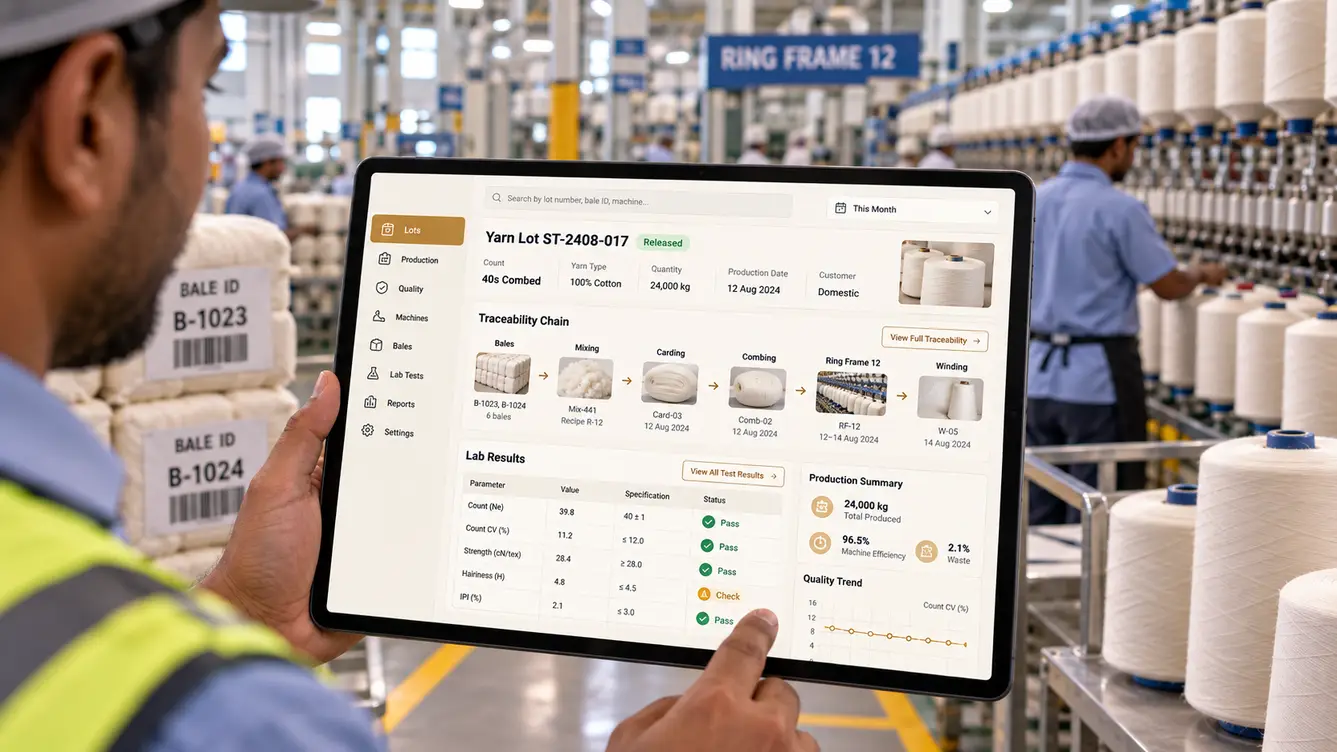
A buyer's complaint and three days of searching
SpinTrack's managing director told us about a buyer who reported uneven yarn in one consignment. Finding which lot, which ring frames and which cotton bales it came from took the quality team three days of registers and memory. The mill's reputation was built on consistency; its records could not prove it.
“We sell trust by the kilo. We need to be able to prove it.”
Walking the process
We walked the process from bale store to packing. Bales were mixed by recipe, processed through carding, drawing, combing and ring spinning, then wound and packed. Lab tests happened at several stages, recorded in registers. Machine output was logged per shift by hand.
- Mixing recipes not linked to output lots
- Lab results in registers, not searchable
- Machine output recorded by hand per shift
- No early warning when quality drifted
Bale to cone
SpinTrack gives bales, mixings and yarn lots barcode identities and records which lots passed through which machines. Lab instruments' results are imported directly and linked to lots. When a test drifts towards its limit, supervisors are alerted before a whole lot goes out of specification.
For buyers, each consignment carries a quality certificate generated from the actual test data, with traceability available on request.
The team
Lab instrument integration and floor usability drove the staffing.
Mill walkthroughs and rollout.
Floor tablets and quality dashboards.
Traceability, production and certificates.
Lab instruments and barcode printing.
Quality drift detection.
6 people in total, working as one team.
Decisions we made
Agreed with the managing director and quality manager.
Manual entry or instrument import?
- Type lab results
- Import directly from instruments
Our call: Import directly from instruments. Direct import removed transcription errors and saved lab time.
Traceability granularity?
- By day
- By lot and machine
Our call: By lot and machine. Lot-and-machine tracing let the mill isolate problems precisely.
Cloud or on-premise?
- Cloud only
- On-premise with cloud sync
Our call: On-premise with cloud sync. The floor must work during outages; management needed remote access.
Every feature, module by module
Everything that shipped for the floor, the lab, management and buyers.
- 01Bale inventory
Bales with origin and fibre properties.
- 02Mixing recipes
Recipes linked to output lots.
- 03Lot barcodes
Lots identified through every process.
- 04Machine routing
Which machines processed each lot.
- 05Trace search
Any lot traced in seconds.
- 06Lab instrument import
Test results imported directly.
- 07Specifications by count
Limits per yarn count.
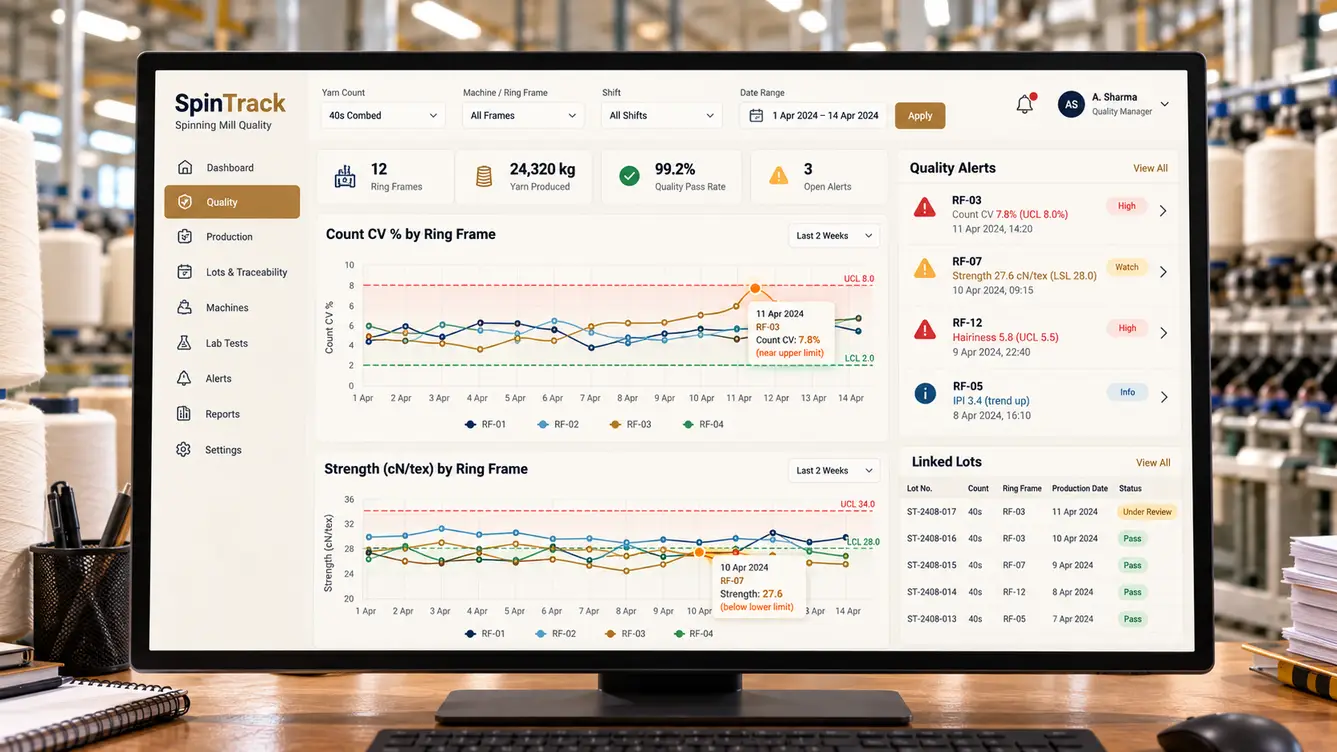
- 08Drift alerts
Warnings before limits are breached.
- 09Control charts
Trends by machine and shift.
- 10Non-conformance records
Issues with actions.
- 11Machine-wise production
Output per machine and shift.
- 12Efficiency tracking
Production against targets.
- 13Shop-floor tablets
Entries and alerts on the floor.
- 14Waste tracking
Waste by process.
- 15Quality certificates
Generated from real test data.
- 16Buyer portal
Certificates and traceability on request.
- 17Management dashboard
Production, quality and waste.
- 18Role-based access
Floor, lab, managers and buyers.
- 19Audit trail
Every record change logged.
Rollout
We started with one yarn count on a subset of machines, then extended across the mill. The next buyer query was answered in minutes, with lot history and test results attached.
- Weeks 1–2Discovery
Process walked from bale store to packing.
- Weeks 3–4Design
Traceability model and floor screens.
- Weeks 5–13Build
Traceability, quality, production and certificates.
- Weeks 14–16Pilot
One count on a subset of machines.
- Weeks 17–18Full mill
All counts and machines.
What we learned
Traceability is a sales asset. Buyers valued certificates backed by real data.
Catch drift, not just failures. Alerts near limits prevented bad lots.
- Next.js
- React Native
- NestJS
- PostgreSQL
- Lab instrument data import
- Barcode lot tracking
- Quality anomaly detection
- On-premise server with cloud sync