LineSight: showing a packaging plant where its production time actually went
A flexible-packaging manufacturer believed its lines ran most of the shift. When we connected the machines, the real picture was very different. We built LineSight: machine connectivity, real-time OEE, downtime reason capture on the shop floor, production planning and quality checks — 25 features that replaced shift-end guesswork with minute-by-minute truth.
What the plant believed
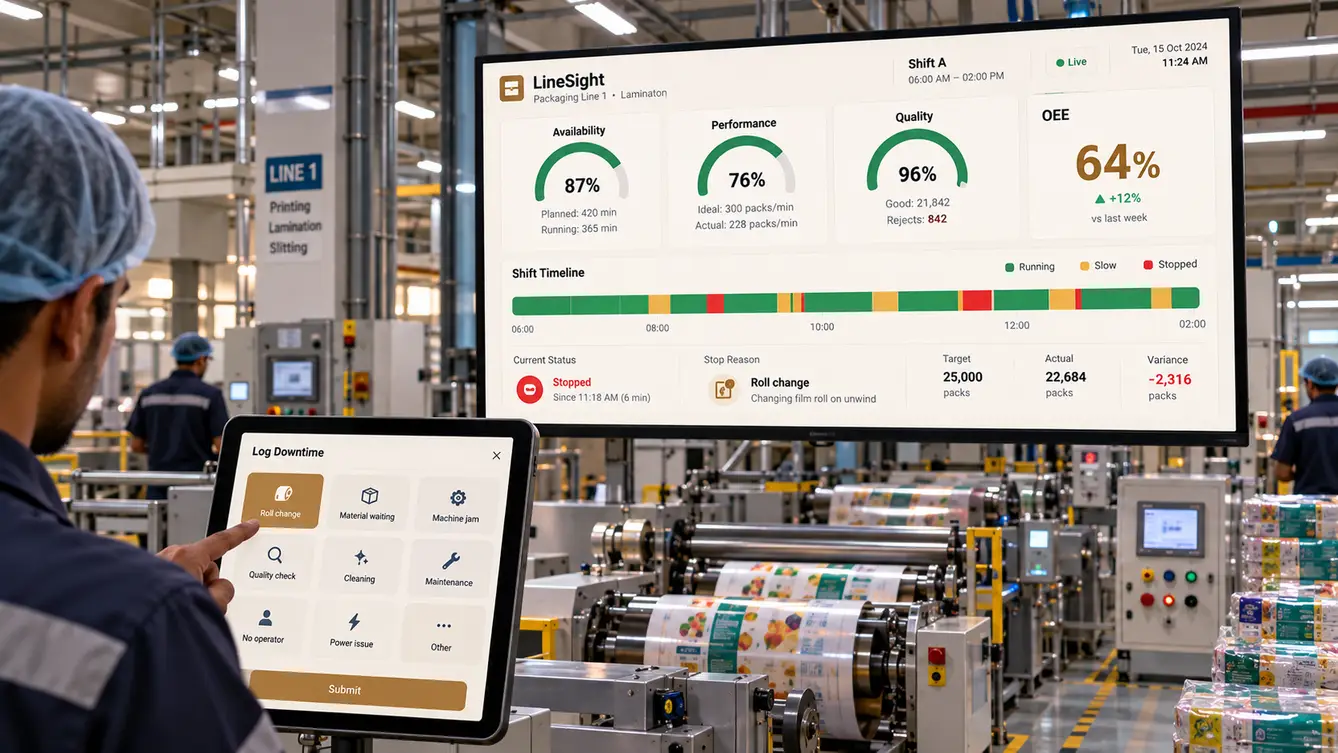
LineSight's plant head was confident: the lines ran most of every shift, and output was limited by orders, not capacity. Shift reports agreed with him. They were filled in by supervisors at the end of each shift, from memory, and they rarely mentioned the dozens of short stops that happened in between.
The owner was less sure. Customers were complaining about late deliveries while the plant said it had spare capacity. He asked us to find out where the time went.
“Our shift reports say we're fine. Our delivery dates say we're not.”
Connecting the machines first
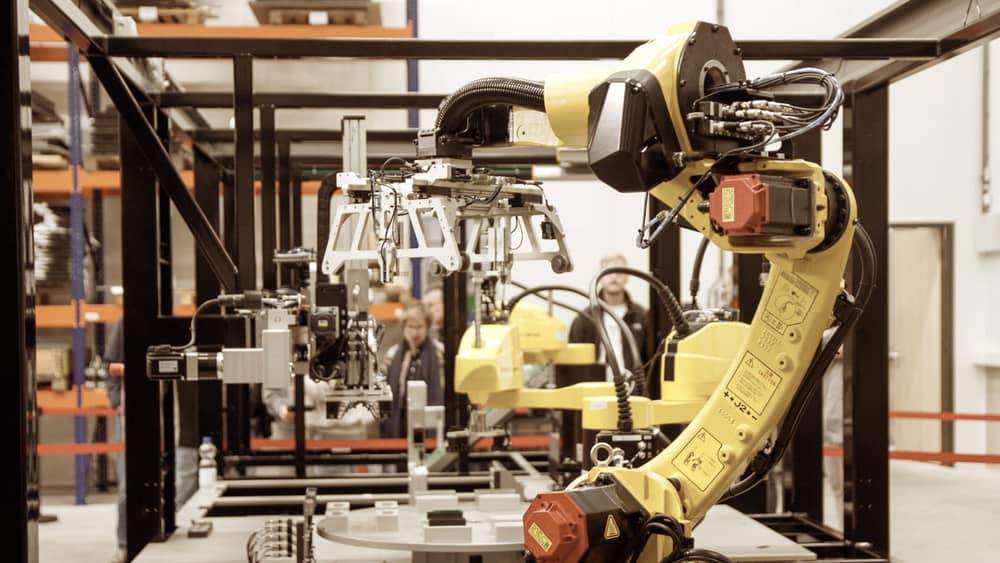
Before building any dashboard we connected three lines — printing, lamination and slitting — with edge gateways reading machine states and counters from the controllers. For older machines without accessible controllers, we added simple sensors on motor current and output counters.
Within two weeks of data, the picture was clear. The lines were stopped far more than the shift reports suggested, mostly in short stops that nobody thought worth recording: roll changes, waiting for material, minor jams and quality checks.
- Many short stops of a few minutes each, never recorded
- Waiting for material as a major hidden cause
- Changeovers taking far longer than planned
- Night shift speeds noticeably lower than day shift
Designing for operators
Machine data shows that a line stopped, not why. We put tablets at each line with a downtime reason picker: when the line stops, the tablet asks why with large icons — roll change, material wait, jam, quality check, maintenance. One tap, gloves on. Stops that are not explained within a few minutes escalate to the supervisor.
A TV above each line shows the shift's performance live, which turned out to be the most powerful feature: operators started competing to keep their line green.
The team
Industrial connectivity needed an engineer comfortable with PLCs and fieldbus protocols, working alongside data and web engineers.
Plant workshops and improvement reviews.
Gateways, PLC and sensor connectivity.
Time-series pipeline and OEE calculations.
Operator tablet, line TVs and management views.
Planning, quality and dashboards.
Predictive maintenance signals.
7 people in total, working as one team.
Decisions we made
Agreed with the owner, plant head and maintenance manager.
Dashboards first or data first?
- Build dashboards on shift reports
- Connect machines and collect data before designing dashboards
Our call: Connect machines and collect data before designing dashboards. Shift reports were the problem. Real machine data had to come first.
Replace older machines' controllers?
- Upgrade controllers
- Retrofit simple sensors
Our call: Retrofit simple sensors. Sensors on motor current and counters gave enough signal at a fraction of the cost and without stopping production.
Cloud or on-premise?
- Cloud only
- On-premise server with cloud sync
Our call: On-premise server with cloud sync. The shop floor must keep working during internet outages. Local processing with cloud sync gave resilience and remote access.
How to capture downtime reasons?
- Supervisor enters at shift end
- Operator taps a reason when the line stops
Our call: Operator taps a reason when the line stops. Reasons recorded at the moment are accurate; end-of-shift memories are not.
The 25 features
Everything that shipped from the machines to management.
- 01Edge gateways
Read machine states and counters from controllers.
- 02Retrofit sensors
Connect older machines without controller access.
- 03Local buffering
No data lost during network outages.
- 04Machine state detection
Running, slow, idle and stopped states.
- 05Live OEE
Availability, performance and quality in real time.
- 06Line TV dashboards
Shift performance above each line.
- 07Downtime reason capture
One-tap reasons on operator tablets.
- 08Unexplained stop escalation
Supervisor alerts for unrecorded stops.
- 09Changeover checklists
Standard steps with timing.
- 10Production scheduling
Jobs sequenced by line with realistic capacity.
- 11Job progress tracking
Output against each order in real time.
- 12Quality checks
In-process checks with results and rejects.
- 13Material staging
Material requests ahead of each job.
- 14ERP integration
Orders in, production confirmations out.
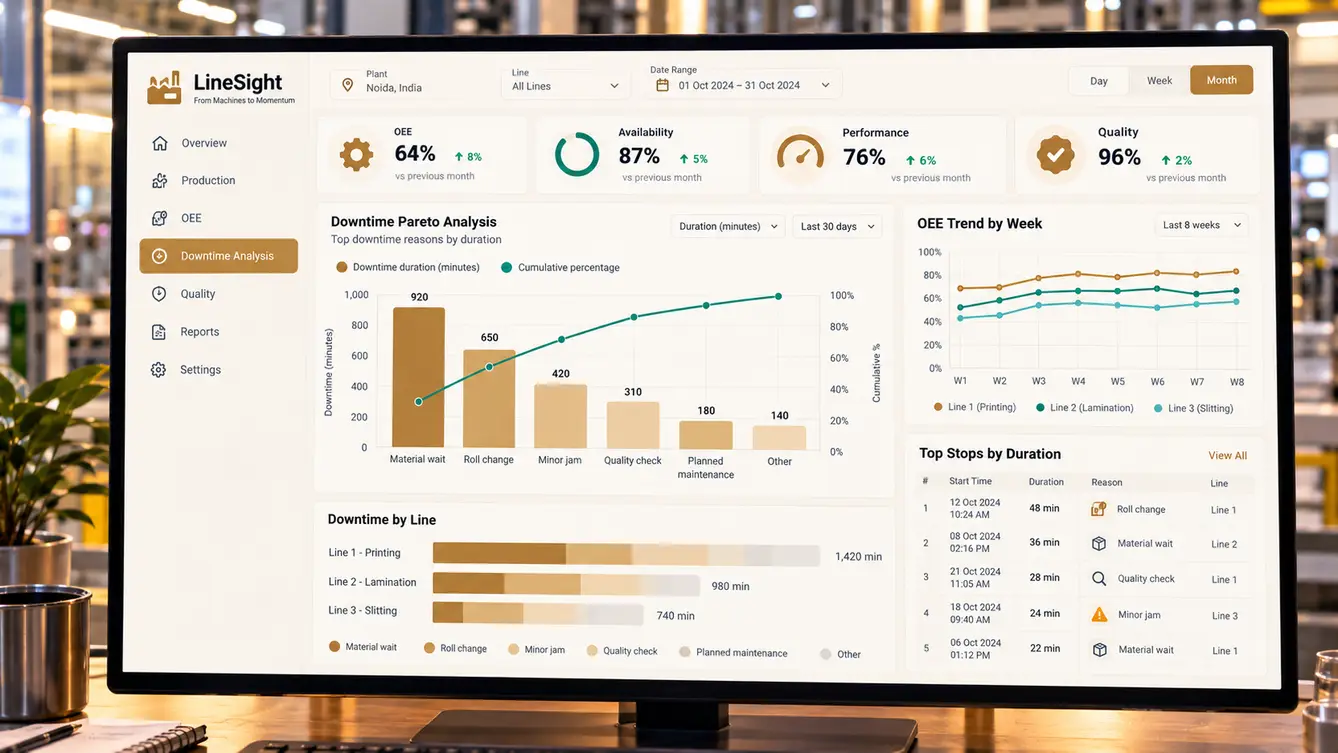
- 15Downtime Pareto
Top causes of lost time.
- 16OEE trends
By line, shift and product.
- 17Shift comparison
Performance by shift and team.
- 18Predictive maintenance signals
Early warnings from machine behaviour.
- 19Energy per unit
Energy consumption per unit produced.
- 20Automated shift reports
Generated from real data.
- 21Role-based access
Operators, supervisors, managers and owners.
- 22Audit trail
Changes to plans and reason codes recorded.
- 23Remote access
Owners view performance from anywhere.
- 24Data export
Raw and aggregated data export.
- 25Alerts
Notifications for long stops and quality issues.
Rollout and the first improvements
With stop reasons captured, the plant attacked the top causes. Material staging before each shift cut material waits; a changeover checklist shortened roll changes. The improvements came from the plant's own people — LineSight just made the problems impossible to ignore.
- Weeks 1–2Discovery
Line walks, shift reports reviewed, machines surveyed.
- Weeks 3–6Connect and observe
Three lines connected; two weeks of real data.
- Weeks 7–8Design
Operator tablet and line TV tested on the floor.
- Weeks 9–16Build
OEE, planning, quality and analytics.
- Weeks 17–20Rollout and improvement
All three lines live; top downtime causes tackled.
What we learned
Measure before you manage. The most valuable output of the project was the first two weeks of honest data.
Make performance visible to the people who control it. Line TVs changed behaviour faster than any management report.
- Edge gateways with OPC UA / Modbus
- MQTT
- TimescaleDB
- Next.js
- Node.js
- Predictive maintenance model
- On-premise server with cloud sync