SahyogHub: helping an NGO prove its impact to donors without burying its field staff in forms
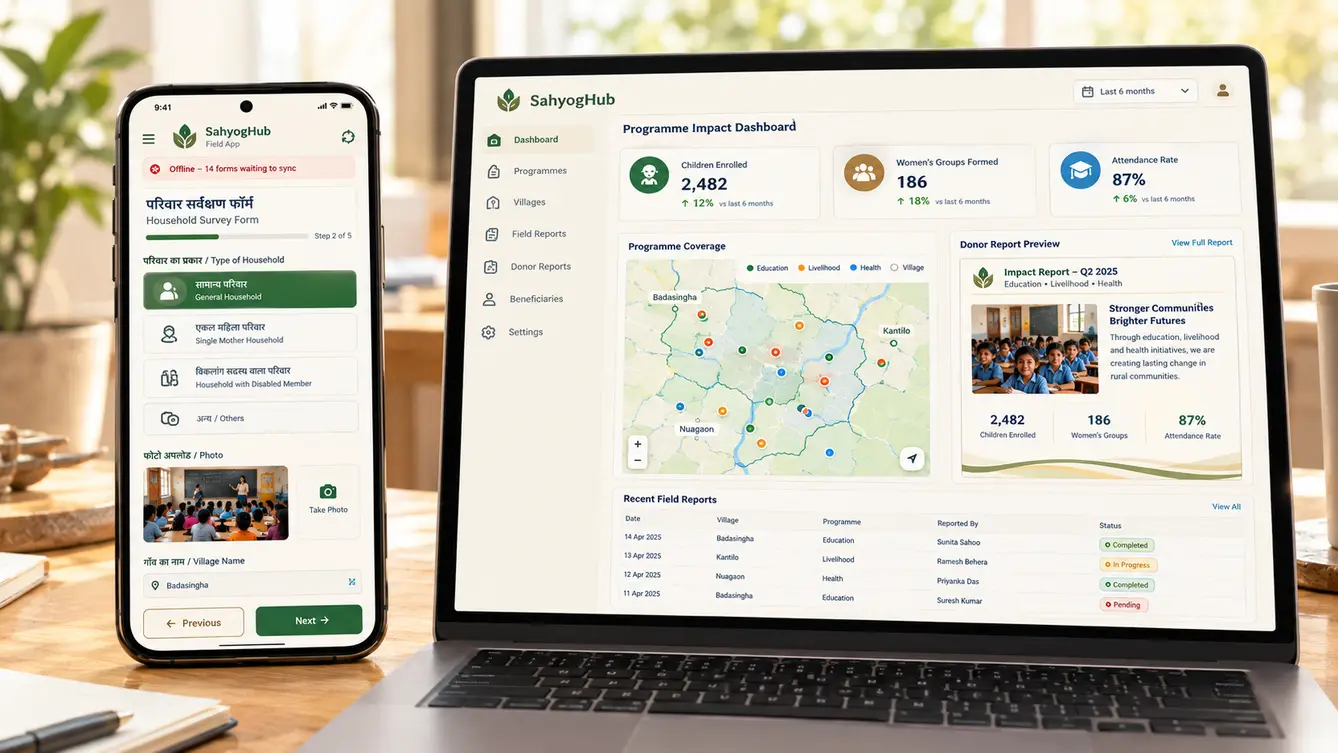
A mid-sized NGO running education and livelihood programmes across hundreds of villages collected field data on paper, compiled donor reports by hand and managed donors in a spreadsheet. We built SahyogHub: an offline field data app, programme dashboards, automated donor reports and a donor portal — 24 features that connected what happened in villages to what donors saw.
Report season
SahyogHub's programme director called the weeks before each donor report "report season". Field coordinators across hundreds of villages filled in paper registers, district offices typed them into spreadsheets, and the head office stitched those spreadsheets into reports for each donor — every donor wanting slightly different indicators in a slightly different format.
By the time a report was ready, the data was months old, and nobody fully trusted the numbers because they had been copied so many times. Field staff, meanwhile, felt they spent more time filling forms than doing the work the forms described.
“Our field staff do extraordinary work. Our reports make it look like paperwork.”
Time in the villages
We spent a week with field coordinators in two districts, visiting learning centres and self-help group meetings. Coordinators were collecting far more data than any report used, often the same information on multiple forms for different donors. Connectivity was patchy, phones were basic, and many coordinators were more comfortable in Odia than English.
The design brief became: collect less, collect once, and let the system produce every donor's view from the same data.
- The same household data collected on multiple donor forms
- Paper registers retyped at district offices
- Many indicators collected that no report used
- Patchy connectivity and shared, basic phones

One indicator framework for every donor
With the programme team, we built a single indicator framework: every activity, output and outcome the NGO tracks, defined once. Each donor's reporting template was then mapped to that framework. A donor asking for "girls enrolled" and another asking for "female learners" draw on the same indicator.
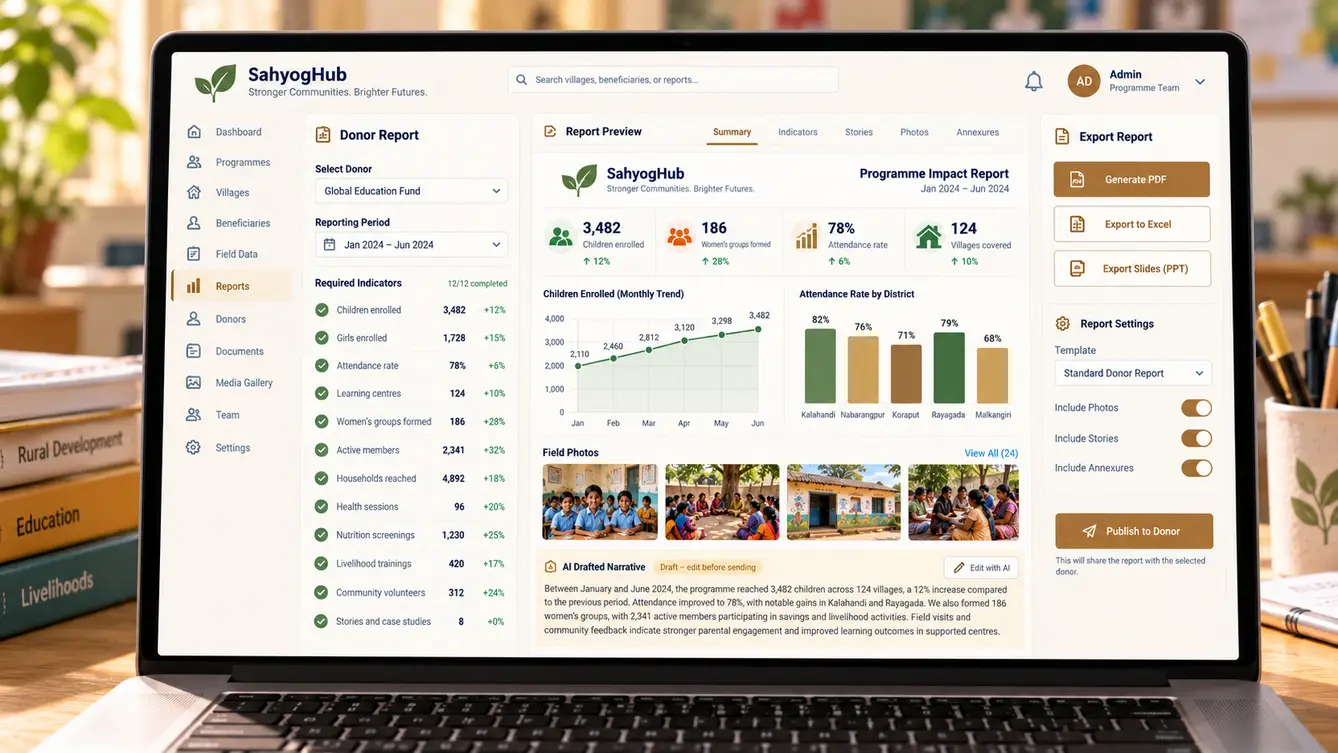
This cut the field forms dramatically. Coordinators now record each activity once, and SahyogHub assembles each donor's report automatically — with an AI-drafted narrative section that the programme team edits before sending.
The team
A data engineer led the indicator framework work alongside the programme team.
Programme workshops, field visits and rollout.
Odia-first field app and donor experience.
Indicator framework, donor mappings and data quality.
Offline field data app.
Dashboards, donor CRM, portal and reporting.
Offline sync testing and report accuracy checks.
7 people in total, working as one team.
Decisions we made
These were agreed with the programme director and the finance and compliance lead.
Separate forms per donor or one framework?
- A form for each donor's requirements
- One indicator framework mapped to every donor
Our call: One indicator framework mapped to every donor. One framework meant data was collected once and reused everywhere, cutting field burden and making numbers consistent across reports.
Online or offline-first field app?
- Online forms
- Offline-first with sync
Our call: Offline-first with sync. Connectivity in many villages was unreliable. Offline-first meant coordinators never lost work.
Should AI write donor reports?
- Fully AI-written reports
- AI drafts narrative sections from real data; staff edit
Our call: AI drafts narrative sections from real data; staff edit. Donors trust the NGO's voice. AI saves drafting time; the programme team owns every word that goes out.
Buy a donor CRM or build one?
- Separate off-the-shelf CRM
- Donor records built into SahyogHub
Our call: Donor records built into SahyogHub. Linking donors directly to the programmes and indicators they fund made reports and renewals far simpler than syncing two systems.
The 24 features
Everything that shipped across the field app, dashboards, donor tools and administration.
- 01Offline forms
Activity and household forms that work without signal.
- 02Odia and English
Bilingual forms with large controls.
- 03Photo and story capture
Photos and short stories attached to activities.
- 04Beneficiary registry
Households and individuals recorded once, reused everywhere.
- 05Validation on entry
Checks that catch impossible values at the source.
- 06Indicator framework
Activities, outputs and outcomes defined once.
- 07Programme dashboards
Progress by programme, district and village.
- 08Village map
Activities and indicators on a map.
- 09Targets and progress
Planned versus achieved for each indicator.
- 10Data quality alerts
Flags for missing or unusual submissions.
- 11Donor CRM
Donors, grants, commitments and renewals.
- 12Automated donor reports
Each donor's template filled from the framework.
- 13AI-drafted narratives
Narrative sections drafted from data for staff to edit.
- 14Donor portal
Donors view progress and field photos online.
- 15Grant utilisation tracking
Spending against each grant's budget lines.
- 16Role-based access
Field, district, programme, finance and donor roles.
- 17Beneficiary data privacy
Sensitive fields restricted and anonymised in reports.
- 18Consent records
Beneficiary consent for photos and stories.
- 19Audit trail
Every data change recorded.
- 20Compliance exports
Data exports for statutory and audit needs.
- 21User and device management
Manage coordinators and their devices.
- 22Multi-programme support
Education, livelihoods and health programmes in one system.
- 23Data export
Full data export at any time.
- 24Sync monitoring
See which devices have unsynced data.
Rolling out to the field
We started with one programme in one district, trained coordinators in person, and kept paper registers as a backup for the first month. Once district staff saw data arriving without retyping, they became the rollout's strongest advocates.
The first donor report produced through SahyogHub took days instead of weeks, and it included photos and stories captured in the field alongside the numbers.
- Weeks 1–3Discovery
Field visits in two districts; donor templates collected.
- Weeks 4–6Indicator framework
Single framework defined and mapped to every donor.
- Weeks 7–13Build
Field app, dashboards, CRM and report generation.
- Weeks 14–16District pilot
One programme in one district with paper backup.
- Weeks 17–18All programmes
Rollout across districts; first automated donor reports.
What we learned
Define indicators before building forms. The framework was the real product; the app was just the way to feed it.
Reduce the burden on the people doing the work. Every field removed from a form was time returned to the programme.
- React Native
- Next.js
- NestJS
- PostgreSQL
- Offline sync
- Report generation with LLM drafting
- AWS Mumbai